

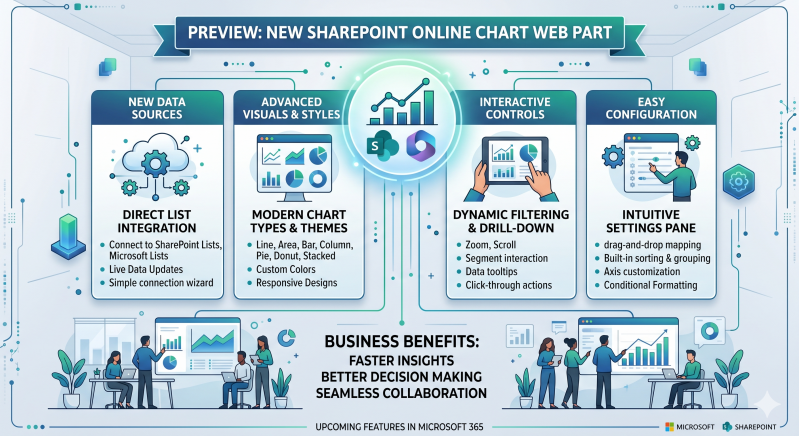
Feature Preview: The New SharePoint Online Chart Web Part
SharePoint Online is introducing a completely redesigned, modernized Chart web part. This new capability enables page authors and content creators to build beautiful, dynamic, and deeply integrated data visualizations directly within SharePoint pages and news posts, removing the historical reliance on complex embed codes or static screenshots.
Key Benefits
- Native SharePoint Integration: Seamlessly connect directly to your existing SharePoint Lists and Document Libraries without configuring external permissions or data gateways.
- Modern & Responsive Design: Charts automatically scale and reformat beautifully across mobile devices, tablets, and wide-screen monitors.
- No-Code Configuration: An intuitive property pane enables any team member to build data visualizations in seconds using a clean, visual interface.
- Real-Time Data Refresh: Visualizations reflect updates immediately when underlying data sources change, ensuring your team portals always display accurate information.
Feature Comparison: Legacy vs. Next-Gen Chart Web Part
The table below contrasts the limitations of previous SharePoint charting workarounds with the capabilities introduced in the upcoming release.

Advanced Feature Breakdown
1. Expanded Chart Selection
Whether you are tracking quarterly performance, project distributions, or timeline trends, the web part provides the appropriate visual tool:
- Comparison (Bar & Column): Perfect for comparing distinct categories or tracking metrics over time.
- Trends (Line & Area): Ideal for visualizing continuous data progressions and highlighting growth patterns.
- Composition (Pie & Donut): Optimized for displaying proportional breakdowns and asset allocations.
2. Direct Data Mapping & Customization
The configuration pane gives authors precise control over how data is processed and presented without requiring complex formulas:
- Smart Aggregations: Automatically calculate Sum, Average, Count, Minimum, or Maximum directly on your list columns.
- Dynamic Sorting: Order chart categories alphabetically or arrange them numerically by value (ascending or descending).
- Custom Labels & Legends: Freely toggle data labels, reposition legends, and customize axis titles to maximize data readability.
3. Seamless Access Control
The web part fully respects existing Microsoft 365 security perimeters. If a user does not have permission to view the underlying SharePoint List or Document Library, the chart component dynamically hides or restricts the data view for that individual, maintaining absolute data privacy across your organization.